DCA-MOL is a PyMOL plugin to interactively visualize coevolutionary residue-residue interactions estimated from Direct Coupling Analysis in contact maps and 3D structures. This is accomplished by mapping highly coupled pairs in sequence families (characterized by either Direct information (DI) scores or other metrics) to specified structures. This plugin makes the analysis easier by allowing the user to select a percentage of ranked DI pairs, plotting a contact map and automatically calculating true positive rates on native contacts. The user can interactively highlight sets of pairs on the contact map and showcase those as links in 3D structures.
DCA-MOL provides a highly efficient tool that helps people understand evolutionary interactions in monomeric proteins and RNA, the role of proteins in conformational dynamics as well as across multiple proteins and complexes, all in one visualization tool.
DCA-MOL is fully written in Python 2.7 and compatible with PyMOL versions from 1.7 to 2.0 (Open Source, Educational, and Evaluation versions, as long as plugin installation is allowed).
Both Matplotlib and Tcl/Tk must be accessible to the Python environment from which PyMOL is started.
Pymol 2.0 comes with its own Anaconda enviroment, which does not include Matplotlib.
(Under Windows):
During installation of PyMOL Anaconda Prompt should also have been installed and can be found in the Start menu.
Otherwise follow the instructions for Linux/MacOS.
(Under Linux/MacOS):
Executable named conda should be present in the bin directory of your PyMOL installation folder.
You can find it by typing in Pymol:
            from pymol import cmd
            print cmd.__file__
which should show a path similar to:
/home/dzarmola/Downloads/pymol/lib/python2.7/site-packages/pymol/cmd.pyc,
where the bold part
indicates the Pymol installation path. In this particular case you can find conda at:
/home/dzarmola/Downloads/pymol/bin/conda
To install Matplotlib type
/path/to/conda install matplotlib (under Linux/MacOS)
conda install matplotlib (from within Anaconda Prompt on Windows).
To run DCA-MOL, you need three input files: a Direct Information (DI) score file, a PDB file with 3D coordinates and a FASTA formatted alignment file.
DI scores file: The DI scores file is obtained as a results of performing Direct Couplings Analysis (DCA) in a family of evolutionary related sequences like the ones found in Pfam (cite) or created by the user using sequence alignment. DCA is a statistical inference framework to infer direct co-evolutionary couplings among residue pairs in multiple sequence alignments. With a FASTA format multiple sequence alignment for a protein or RNA family (from Pfam or Rfam), a user can submit a job to the DCA webserver (dca.rice.edu) or run DCA in a MATLAB implementation of the code downloaded from the website. A DI file contains scores for all the possible residue-residue interactions in the MSA. For more information about DCA and how to submit the jobs, you can check the DCA paper[1] or this site.
The output DI scores file from the server consists of three columns, the first two columns represent the coupled residues indices in the MSA and the third column contains the DI scores for these pairs. The default setting of DCA-MOL assumes three columns (Fig. 1) as input. When you run the DCA within the MATLAB implementation, the output consists of four columns where the fourth column represents the DI score, a popup will appear asking the user to indicate which column contains DI scores. We also note that the input to DCA-mol could in principle come from any other method to score pairwise couplings, as long as the input file has a similar column format – with first two containing position indices, and later a column with the pairwise metric.
Pro tip: There are some example files given along with the plugin code on GitHub.
PDB 3D coordinates: To visualize selected couplings on a specific structure, 3D coordinates of the biomolecule are required. The user has three options to load the structure in DCA-MOL (Fig. 2):
After uploading the structures, you need to select which chain in the structure is related to the MSA you analyzed with DCA. If no chain name is provided, the first chain present in the structure file will be selected by default.
FASTA formatted alignment file: To map the DI scores to the structure, the user must extract the sequence from the family input MSA that corresponds to the sequence of the structure of interest. To find this sequence in the MSA, the simplest way is to compare the name of the sequence in Uniport by the Uniport ID that is provided by PDB database. For example, the PDB (5DN6) chain A sequence has a Uniport ID "A1B8N8", the name in parenthesis "ATPA_PARDP" is the name used in the Pfam MSA. Once the ID is known, the user can easily extract the sequence from the alignment and create the FASTA formatted alignment input file.
Note: in principle the user could have multiple sequences and interactively select the proper one. However, for large MSA files the selection becomes impractical.
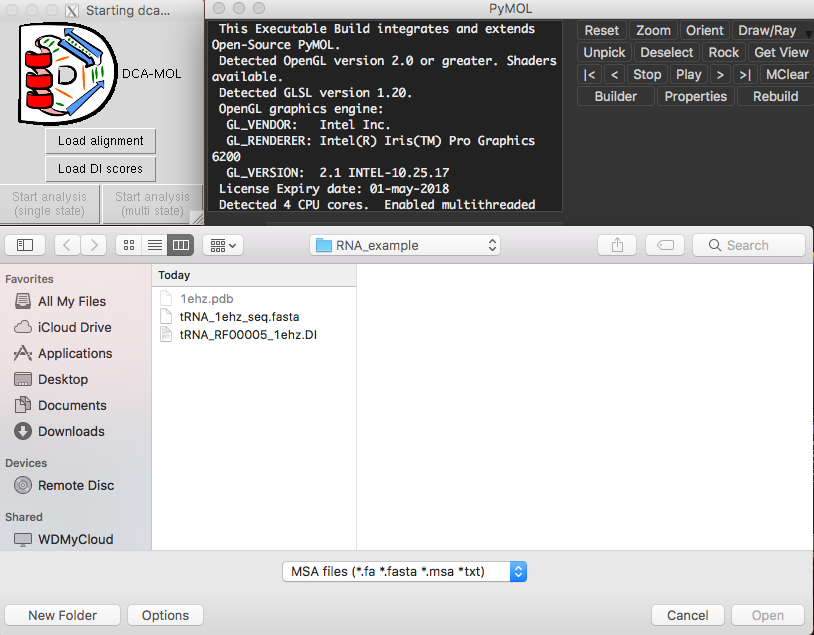
Fig. 1 DI file and FASTA formatted alignment file loading screen.
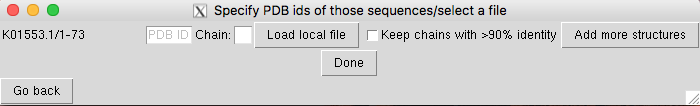
Fig. 2 Specific PDB structure selection screen.
The first step of DCA-MOL is loading the alignment file and DI scores files, starting the analysis by choosing single-state (for visualization of monomeric or interfacial interactions) or multi-state (to analyze multiple protein structures or conformations). Verify the alignment sequence name that is related to a structure, then select process with protein or RNA/DNA and load the structure.
The DCA-MOL analysis starts by creating a pairwise alignment between the sequence from the FASTA formatted alignment file and sequence read from the 3D coordinates file. The alignment will be presented to the user and will allow the user to correct any potential mismatches that the user might be aware of. After this, the distance of molecules in the structure will be calculated. Note: This may take a couple of seconds to finish computation.
The main visualization outputs of DCA-MOL are a DI score contact map plot and a 3D structure visualization of selected couplings in the map. The default contact map is the plain symmetric DI scores contact map (all DI pairs which over the "Lower range" threshold will be shown in the contact map, colored by the scores). (Fig. 3, left) It is possible to later modify both the contact map plot and 3D structure plot by using several features included in DCA-MOL.
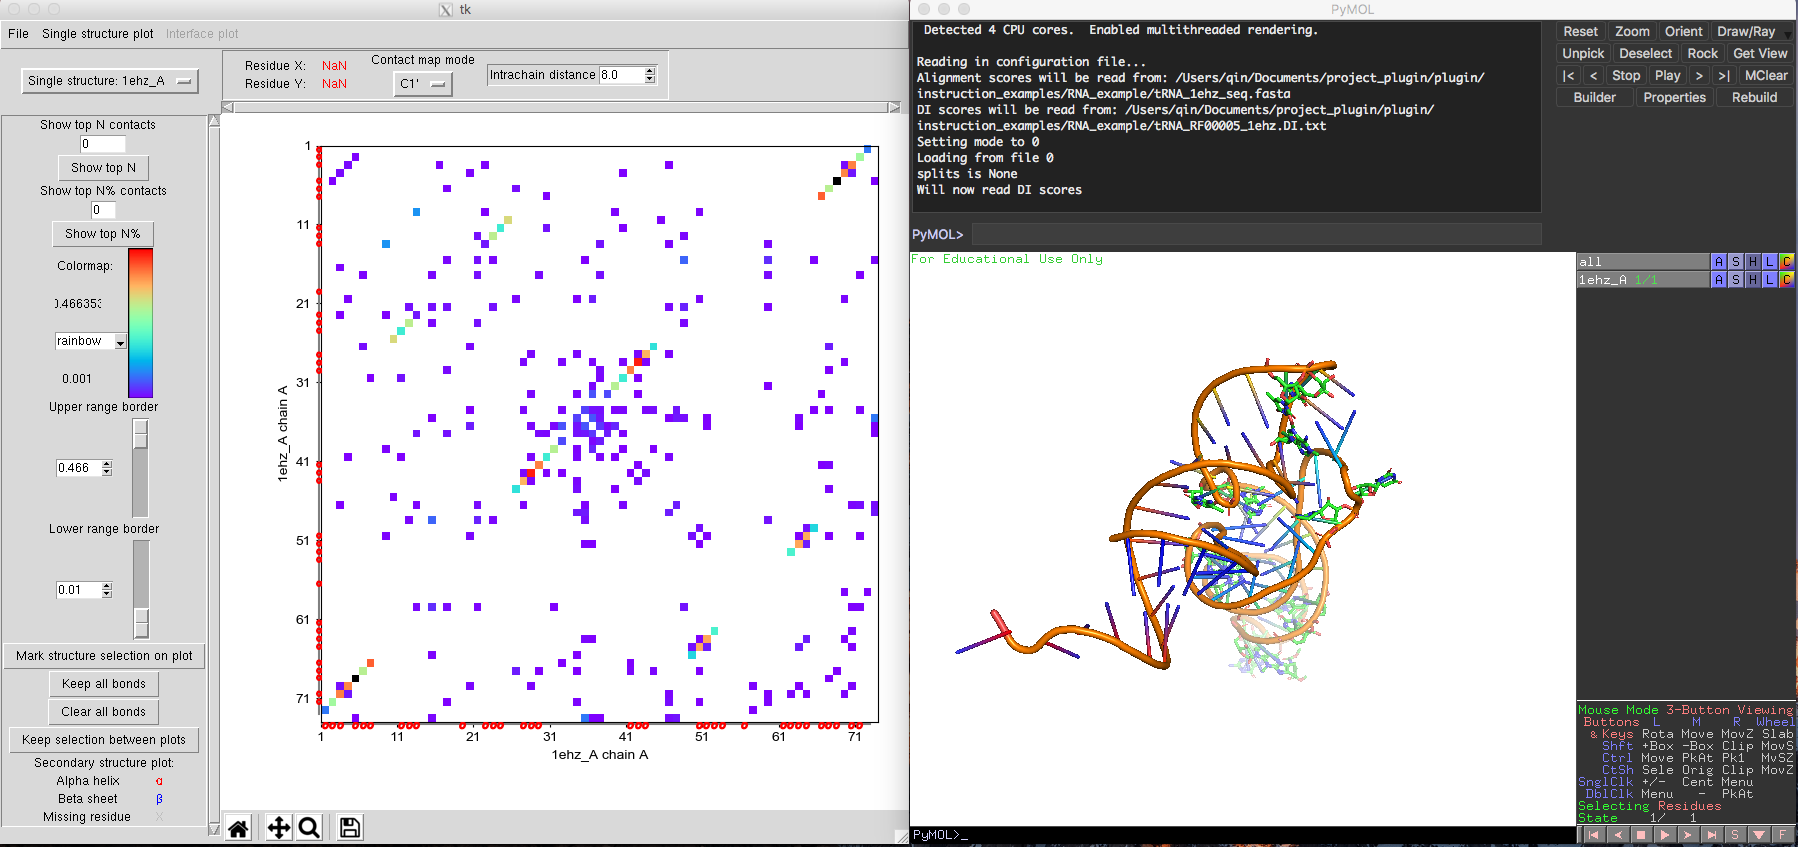
Fig. 3 Basic view of a tRNA contact map and its 3D coordinates in DCA-MOL.
The default contact map in DCA-MOL depicts a plot of DI scores all residue-residue pairs in a given sequence alignment. The user can select a set of pairs to be displayed in the contact map based on their minimum values ("Lower range border") and their maximum DI value ("Upper range border"). The number of shown DI pairs can also be restricted using the option "Show top N contacts" and "Show top N% contacts as illustrated in Fig. 4.
For each contact map, it is possible to specify the color of DI pairs from the drop-down list of Colormap. Secondary structure of each region is represented with different colors along the y-axis and x-axis (red for alpha helices and blue for beta sheets in protein). For RNA, only helices are shown and indicate the base-pairing. If some residues don't have coordinates in their structure, gray 'X' will be shown along the y-axis and x-axis.
Below the contact map plot is the Matplotlib navigation toolbar, which includes panning and zooming capabilities, and information regarding current cursor position and the value of it.
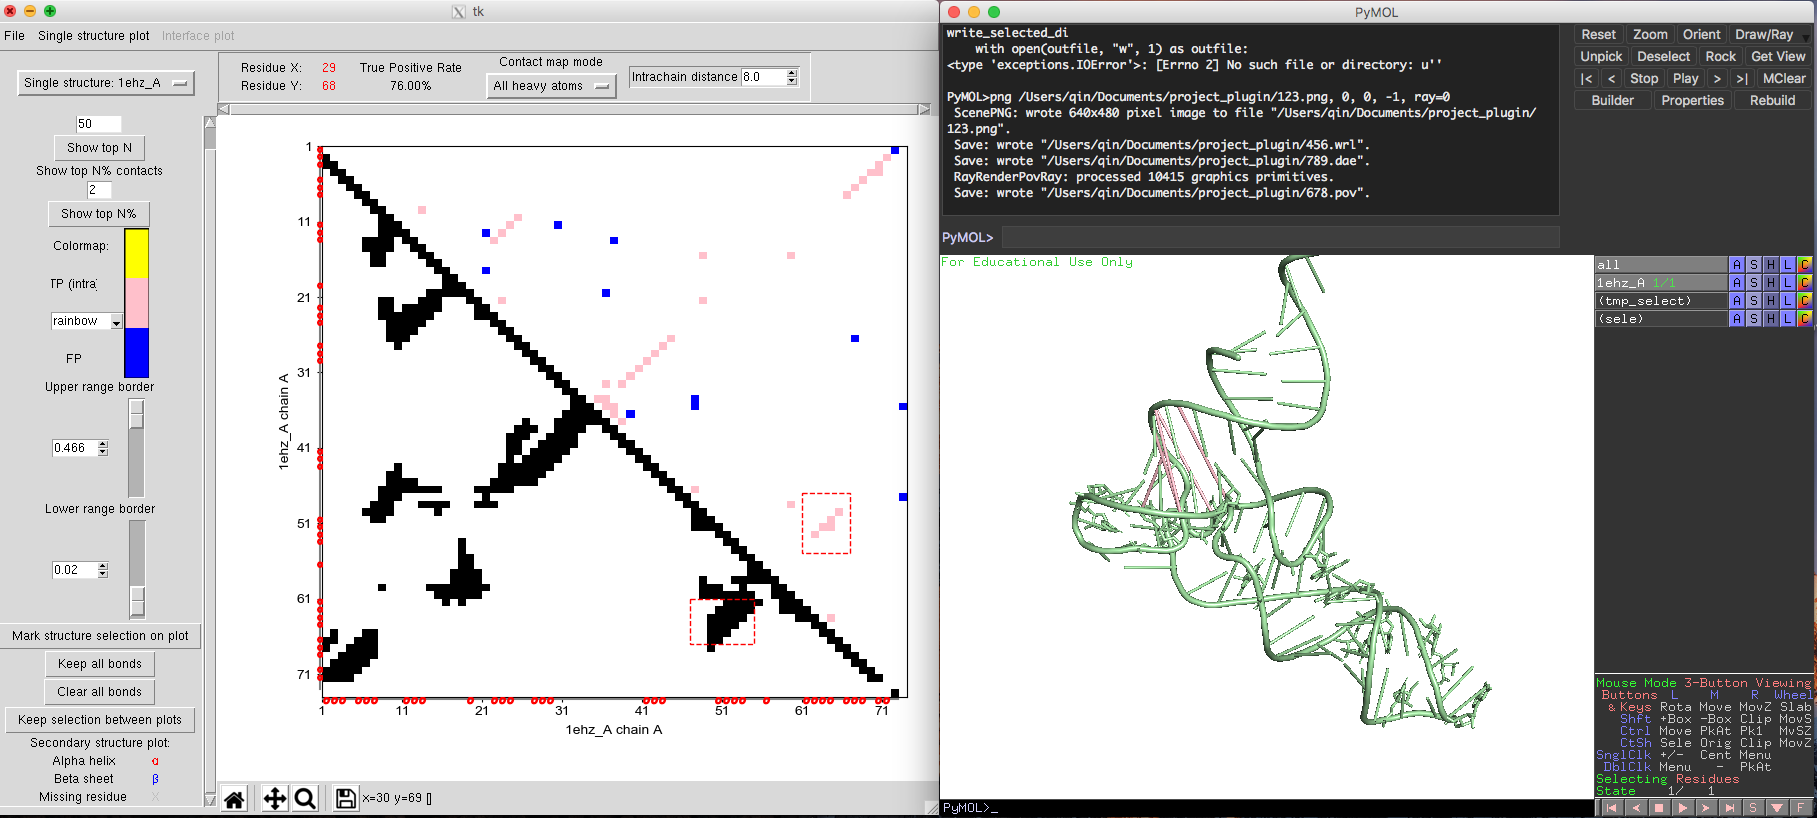
Fig. 4 Alternative contact map plot and structure plot of tRNA.
Selecting contacts on the DI contact map plot (either by a single click or by clicking and dragging) will show coevolving pairs in the structure visualization window as sticks connecting paired residues. The color of the interaction links is following the dot color in contact map. Selecting while holding "Ctrl" key will allow the user to have multiple selections in different regions. Selecting with the Right Mouse Button marks inter-chain contacts (interaction across different chains). Intra-chain selections are shown on the plot as red dashed rectangles, inter-chain as green. It's possible to toggle selection between these two states using the "Toggle inter/intra chain selection" button with the single structure plot menu.
In addition to be able to select pairs on the contact map, you can also select spatial regions in the PyMOL viewer window (either by selecting the sequence, or on the structure) and then click on the "Mark structural selections on the plot" button, in the left control bar. A corresponding rectangle will be shown on the plot, and contacts within will appear on the structure.
The single structure plot menu can be detached from the window by clicking on the dashed line in the first row of the menu. This menu contains alternative plot modes for a given structure, which include:
Using the File menu you can save the currently shown plot in multiple formats as well as write out the native contacts, DI pairs, displayed bonds and distances. Additionally, default program options can be changed in Options menu, such as default color map, resolution of saved images, and colors for True Positive maps.
All menus can be detached from the DCA-MOL window by clicking on the dashed line in the first row of the menu.
In addition to the different styles of contact map plots and structural visualization, DCA-MOL also provides different models of analysis. Here we showcase some sample cases:
All the input files for the examples below are provided along with the plugin code on GitHub.
Monomeric interactions inside proteins or RNAs could be analyzed by the single state model. The tRNA example shown in Fig. 5 was obtained using the single state model. The ATP synthase protein [PDB-5DN6, Pfam PF00006] provides another example for the single state model of DCA-MOL. By adjusting the contact display to show the top 200 contacts, DCA-MOL generates a contact map. Native contacts in this example are defined as pairs whose distances are shorter than 8 Å in the 3D structure. The map shows a true positive rate about 61%. By marking the DI contacts in 3D structure, DI pairs not only successfully capture the alpha helix and beta sheet interactions (Fig. 5), but also capture some long-distance interactions (Fig. 6). These long-distance interactions are far away in the sequence but very close in structure. This information could be very useful in protein structure prediction.
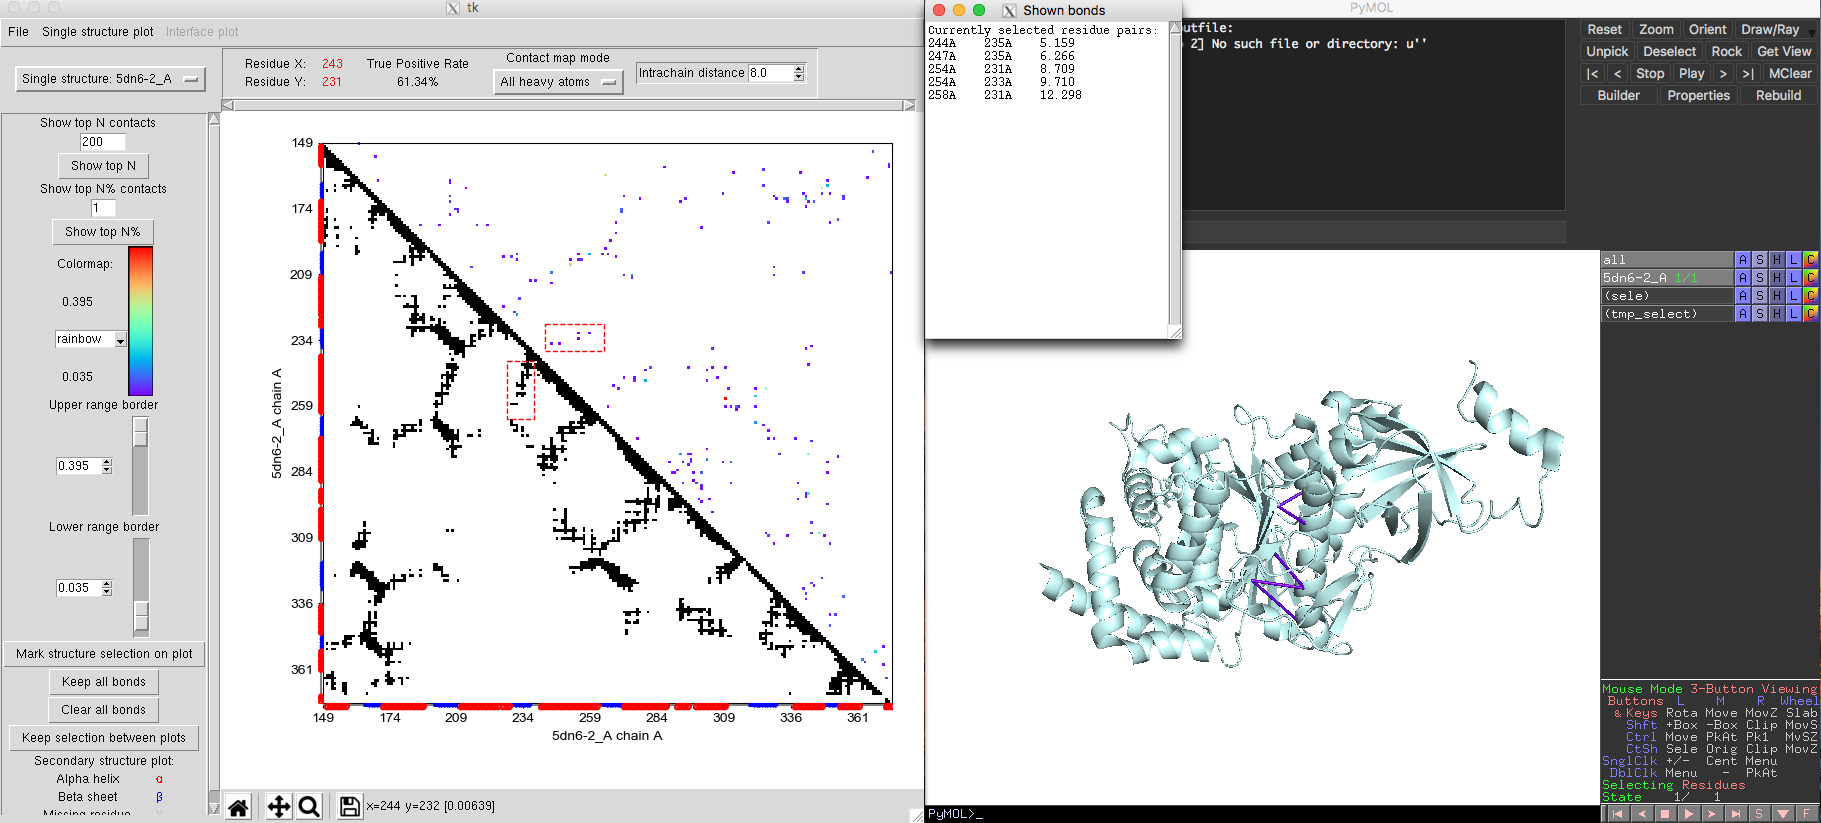
Fig. 5 Interaction between alpha helix and beta sheet in ATP synthase (5DN6).
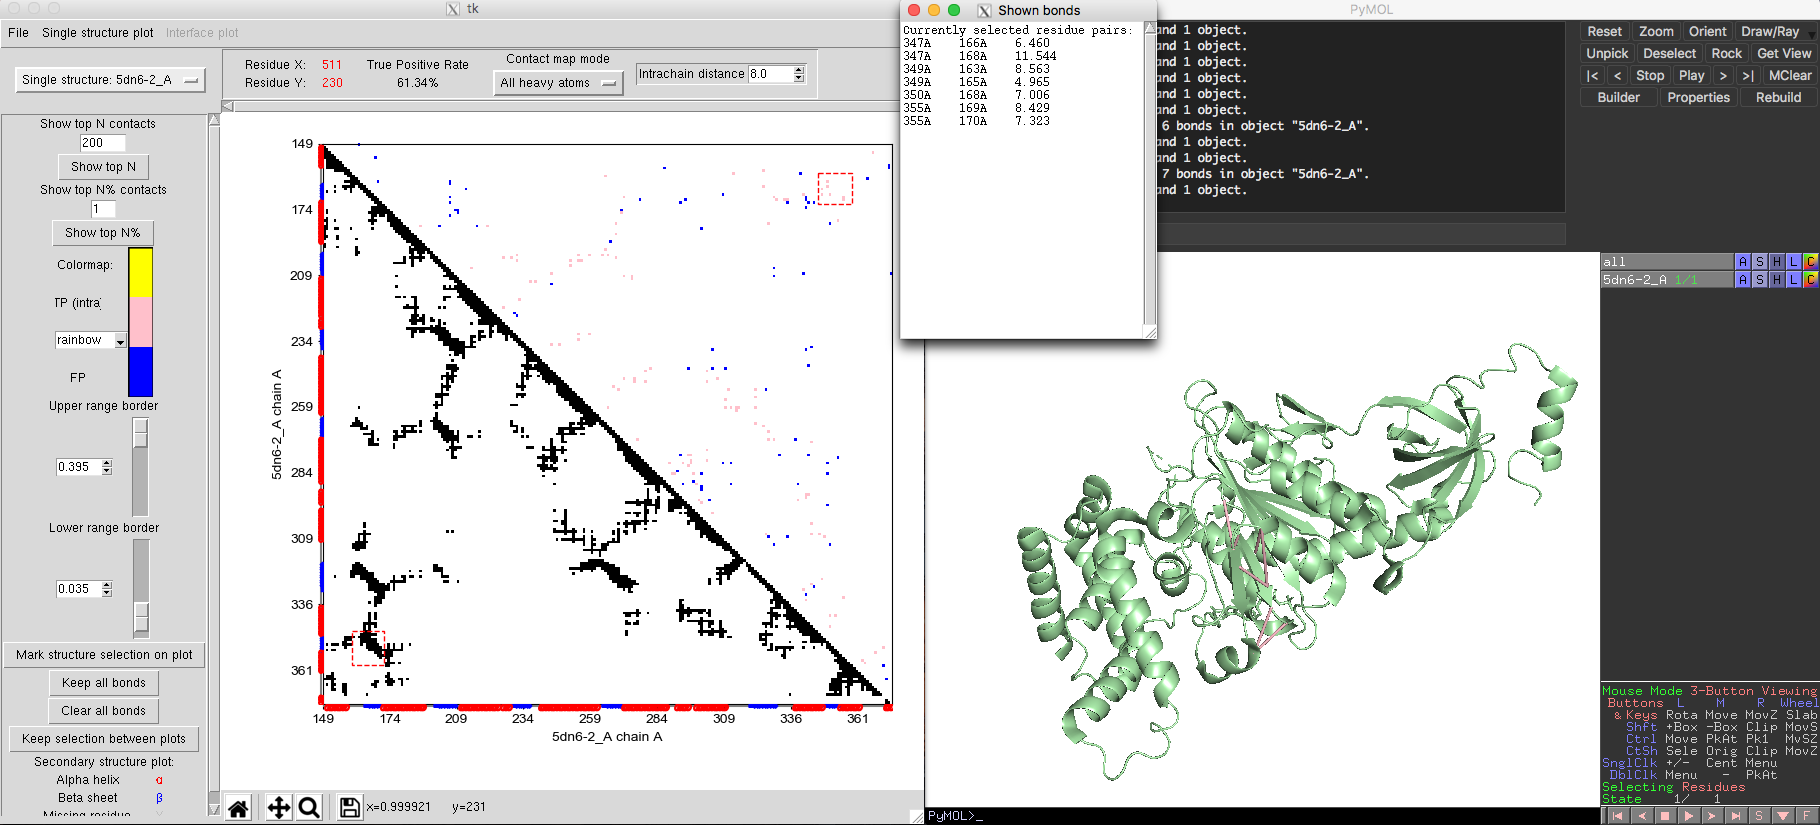
Fig. 6 Long distance interactions in ATP synthase.
Interactions between residues in proteins are not limited to a single domain but can appear between residues of different domains. Studies using DCA showed that coevolutionary information could be used to capture both the information of intra-chain as well as inter-chain interactions. But how to separate these interactions and further study the function of different types of conformations becomes time-consuming for switching the analysis between several models. DCA-MOL provides a highly efficient tool that allows people to easily switch and compare between intra-chain and inter-chain interactions.
In this sample case, we use isocitrate dehydrogenase dimers to showcase this utility (Fig. 7). Isocitrate dehydrogenase is a homodimer containing two chains (A and B) [ PDB id 2iv0 and Pfam ID PF00089.25]. In order to let DCA-MOL analyse both the monomer and the dimer interaction, our input FASTA formatted alignment has slight differences compared to the basic single state study. The alignment file should contain the alignment sequences for both chains. Because isocitrate dehydrogenase is a homodimer, we duplicate the alignment in the input file. After loading the DI score file and alignment file, we start the analysis by clicking single state. Then the program will ask you 'for which sequences(s) from the alignment do you want to assign a structure'. The user needs to select both alignment sequences provided in the previous step and proceed as "protein", loading for each sequence different chains (A/B) from the same PDB file, and check the 'part of an interface' option.
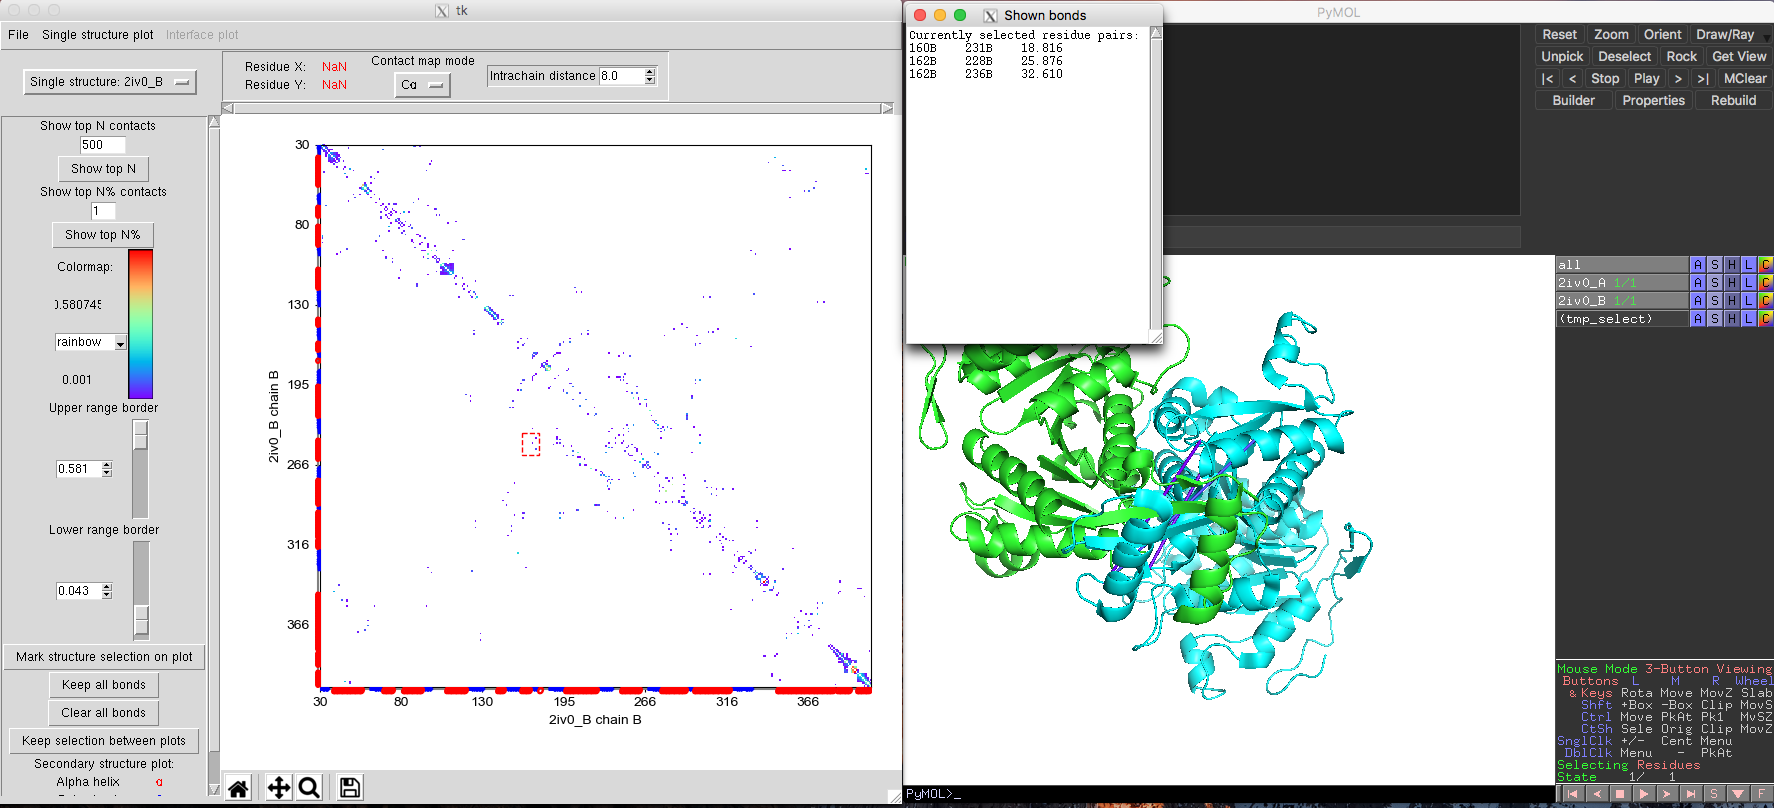
Fig. 7 DI pairs in Isocitrate dehydrogenase monomer showing long distance interactions in the structure.
The default plot will show monomeric interactions. Then you can select "Interface model" from the drop-down list in the upper left corner of DCA-MOL. The program will recalculate the native contacts and show you the interface plot. You can easily return to the intra-chain study by selecting the other option from the drop-down list. Some high ranked DI pairs interactions are far away from each other in the monomer (Fig. 7) structure. But in the dimer structure, these pairs are very close (Fig. 8). This change in distance for these pairs suggests these interactions maybe important to keep quaternary structure and function.
Same strategies could also be applied for large complexes by increasing the sequences in alignment files and input structures.
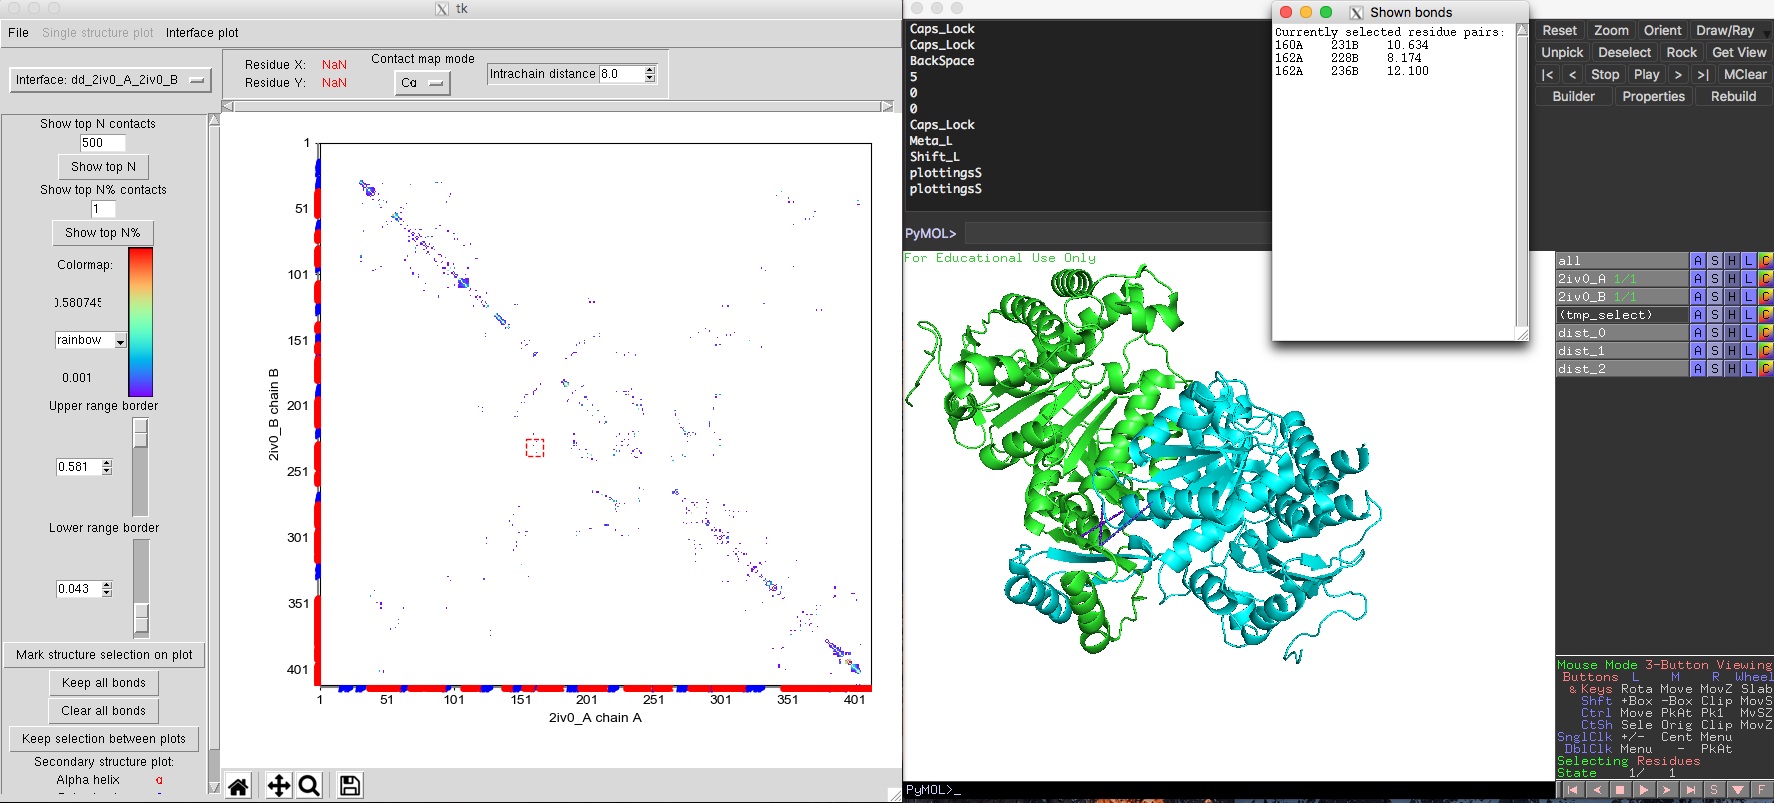
Fig. 8 Same DI pairs across the interface of isocitrate dehydrogenase dimer showing shorter distance in the structure.
Some proteins may experience large conformational changes. DCA-MOL could help you easily study how coevolving pairs play a role in different protein conformations (treated here as as multiple states). Here, we use DCA-MOL to illustrate the conformational change of L-leucine binding protein [PDB IDs 1usg and 1usi, Pfam PF13458.5]. L-leucine binding protein has two states, open state 1usg and closed state 1usi. Since the protein sequences are identified in two structures but with different conformations, we just need one alignment sequence in the alignment file. After loading the alignment file and DI scores file, we start the analysis by choosing "multi-state". When specifying the PDB structure, we first load the open state (1usg, chain A) and click "add more states" to add the closed state (1usi, chain A).
The contact map is very similar to the single state contact map. But in the right upper corner of the contact map plot, you will find the option 'change current state'. This allows you to switch between different states. The order of the states will be the same as the one the user used to load the structures. After choosing the native contacts comparison mode. The native contacts map (lower triangle) shows a similar pattern between two states, except for a set of contacts exclusive to the closed state. In the predicted DI contact map, we get very accurate interaction information for both open state and closed state. Some DI pairs showing a long-distances in Fig. 9 of the open state structure would be normally considered as false positives. However, when marked these DI pairs on the closed state, these DI pairs are very close in the structure (Fig. 10). The comparison between open and closed state indicates that these DI pairs are essential for the protein's functional conformational change. By integrating the structure information taken from different states, DI pairs could help people to identify an ensemble of different conformation of the protein along with their coevolutionary signals. The multiple states model of DCA-MOL will allow you to clearly visualize the interactions during protein dynamics.
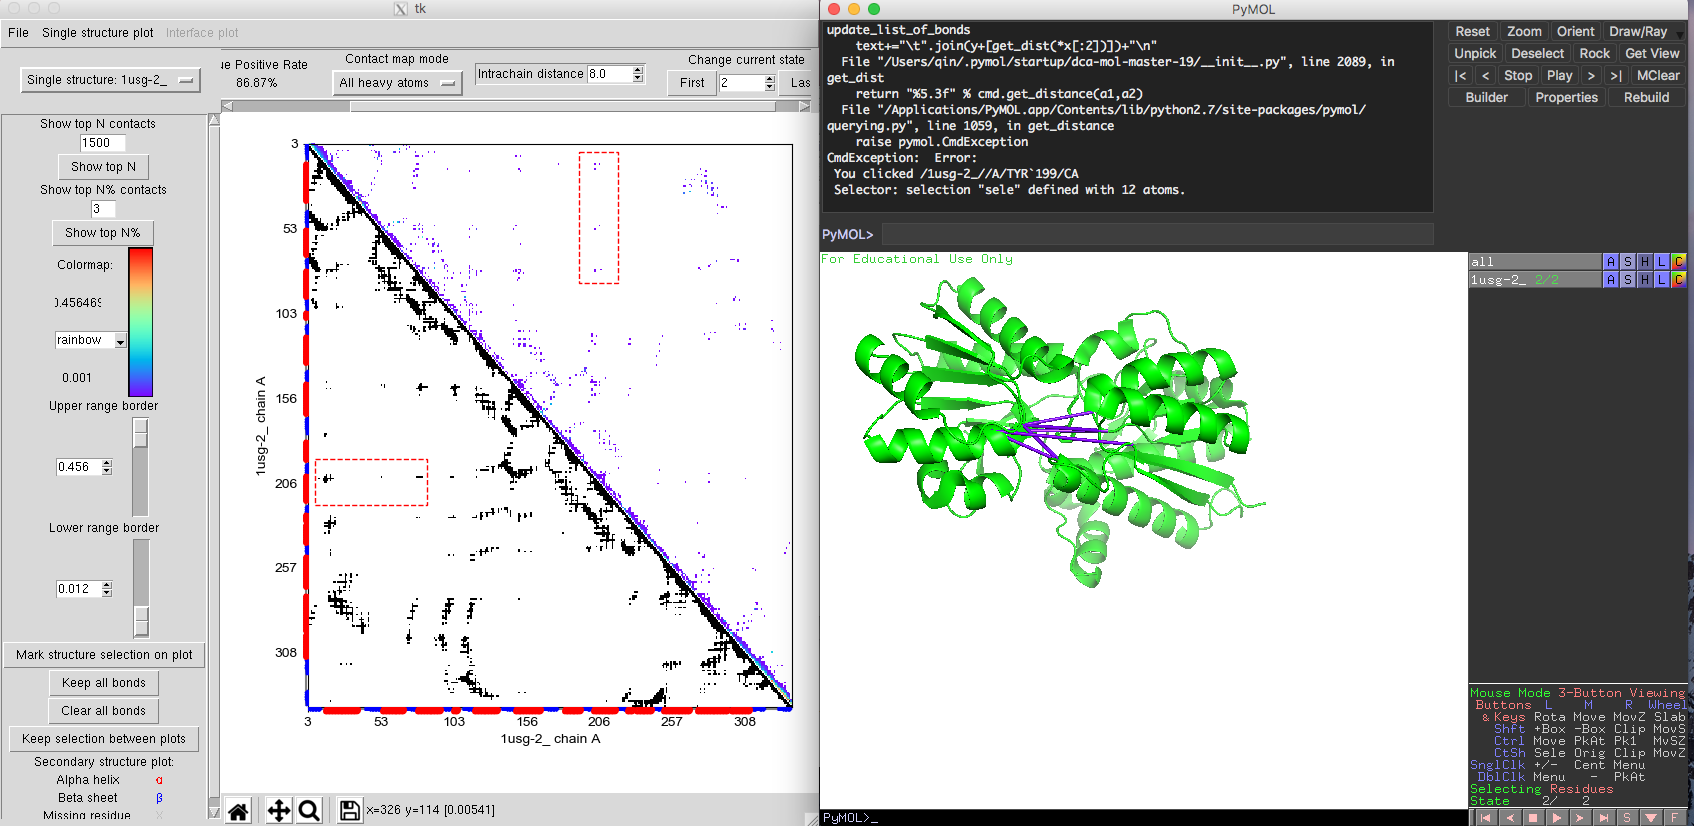
Fig. 9 Multiple states of L-leucine-binding protein. Open state 1USG
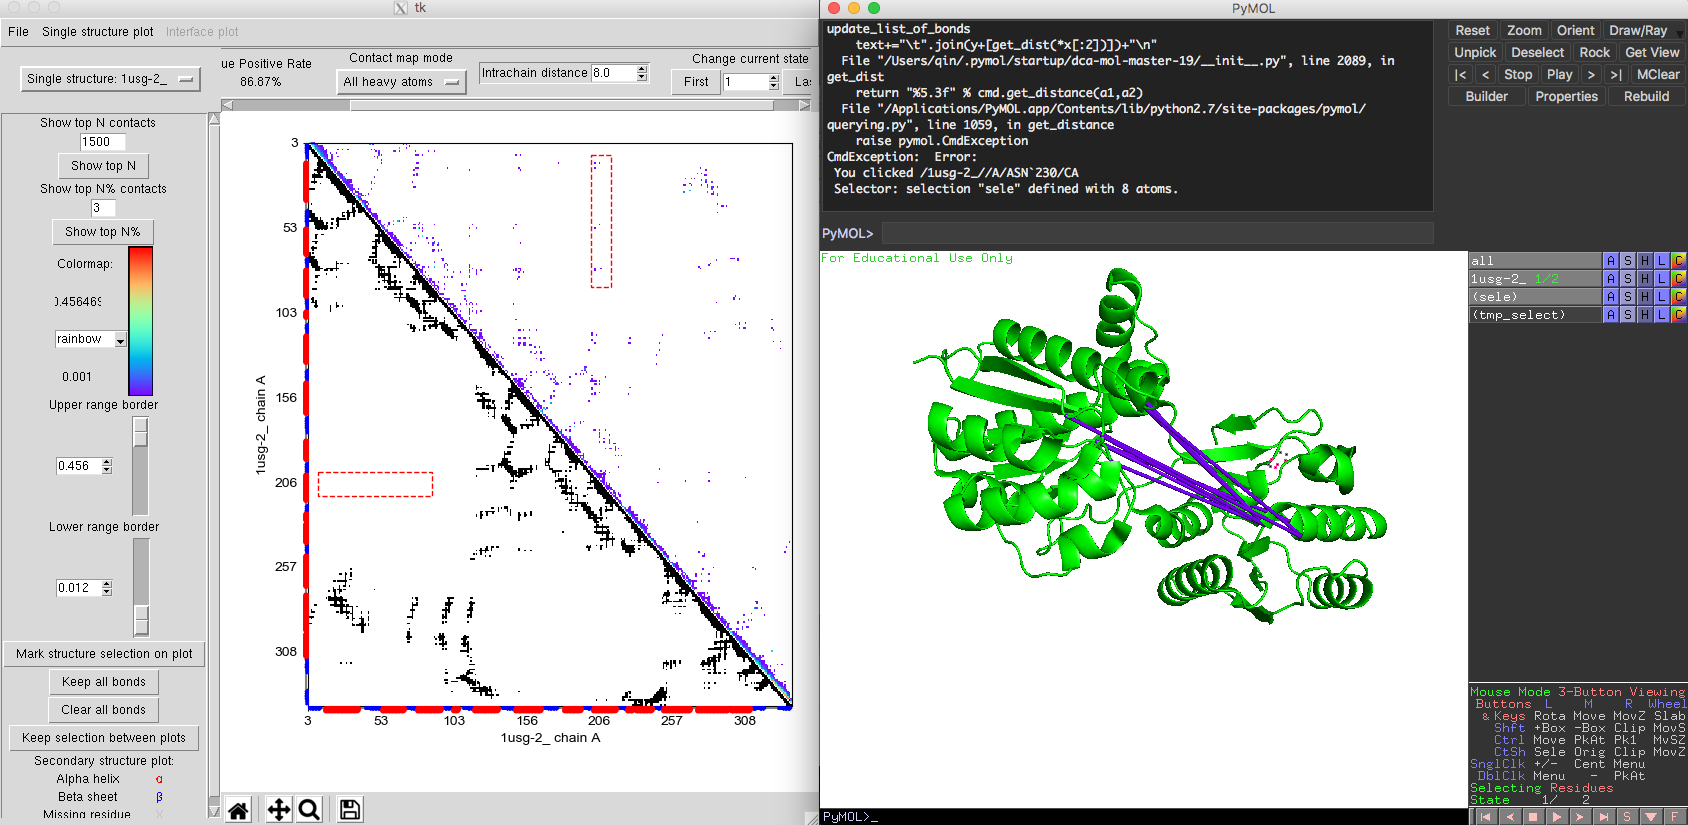
Fig. 10 Multiple states L-leucine-binding protein. Closed state 1USI
Source code of DCA-MOL can be downloaded from GitHub: DCA-MOL.
![]() This software is maintained by
This software is maintained by
Interdisciplinary Laboratory of Biological Systems Modelling.
Any questions regarding the plugin should be directed to: Aleksandra Jarmolinska (a.jarmolinska (at) cent.uw.edu.pl) or Joanna Sulkowska (jsulkowska AT cent.uw.edu.pl)
When using DCA-MOL pleas cite us with:
Jarmolinska A, Zhou Q, Sulkowska J, Morcos F DCA-MOL - a PyMOL plugin to analyze direct evolutionary couplings (under review)
Other references:
1) Morcos, F. et al. Direct-coupling analysis of residue coevolution captures native contacts across many protein families. Proc Natl Acad Sci U S A 108, E1293-1301, doi:10.1073/pnas.1111471108 (2011).
2) Morcos, F., Jana, B., Hwa, T. & Onuchic, J. N. Coevolutionary signals across protein lineages help capture multiple protein conformations. Proc Natl Acad Sci U S A 110, 20533-20538, doi:10.1073/pnas.1315625110 (2013).
3) Sulkowska JI*, Morcos F*, Weigt M, Hwa T, Onuchic JN. Genomics-aided Structure Prediction (GASP). Genomics-aided Structure Prediction (GASP)